Roundabout Safety
The Wisconsin Department of Transportation (WisDOT) is a national leader in roundabout implementation with over 250 roundabouts built in the state and over 150 in the planning phase (http://dot.wi.gov/safety/motorist/roaddesign/roundabouts/index.htm).
WisDOT and the University of Wisconsin Traffic Operations and Safety (TOPS) Lab have worked together on eight different roundabout studies over the last several years to better understand various elements of roundabout design, operations, maintenance and safety. The TOPS Lab conducted safety analyses of roundabouts on the Wisconsin state system in 2009 and conducted a phase 2 study in 2012. Currently, TOPS Lab is performing Phase 3 of safety research. Please refer to the project page for more information. TOPS team also collected video data at several multilane roundabouts in WI and identified causes for crashes at multilane roundabouts.
Incorrect Lane Choice
Lane Change in Circulating Lanes
Wrong Yielding
Failure to Yield to All Circulating Lanes
References:
- Dongxi Zheng, Xiao Qin, Ross Tillman, and David A. Noyce. Measuring Modern Roundabout Traffic Conflict Exposure. Journal of Transportation Safety and Security, Vol. 5(3), pp. 208-223, 2013. [pdf
- Xiao Qin, Ghazan Khan, Andrea Bill, and David A. Noyce. Comprehensive Safety Evaluation of Roundabouts in Wisconsin. Journal of Transportation Safety & Security, Vol. 3(4), pp 289-303, 2014. [pdf]
- Ghazan Khan, Andrea Bill, David Chiu, and David Noyce. Safety Evaluation of Wisconsin Roundabouts: Phase 2, 2013 [pdf]
- Andrea Bill, Xiao Qin, Madhav Chitturi, and David A. Noyce. Comprehensive Evaluation of Wisconsin Roundabouts Volume 2: Safety Findings, 2011. [pdf]
Roundabout Operations
TOPS Lab performed operational evaluation of a number of roundabouts in Wisconsin and collected critical gap and follow-up headway information. TOPS Lab also developed guidelines for calibrating roundabouts in VISSIM. In addition, TOPS Lab evaluated a series of software packages for modeling roundabout operations: RODEL, ARCADY, RCAT, Kreisel, Girabase, HCS 2010, and SIDRA.
Critical Gap and Follow-up Headway
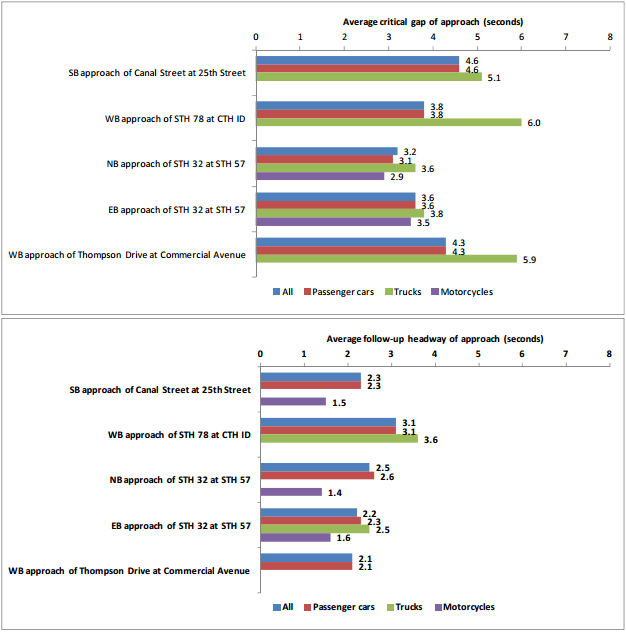
Figure 1. Average critical gaps and follow-up headways of studied sites considering exiting vehicles. [ref]
VISSIM Modeling
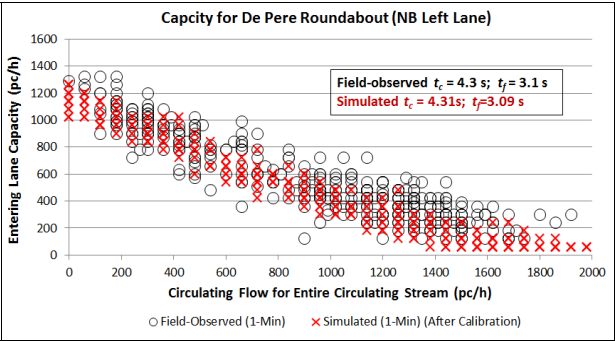
Figure 2. Calibrated VISSIM simulation result. [ref]
Roundabout Software Evaluation
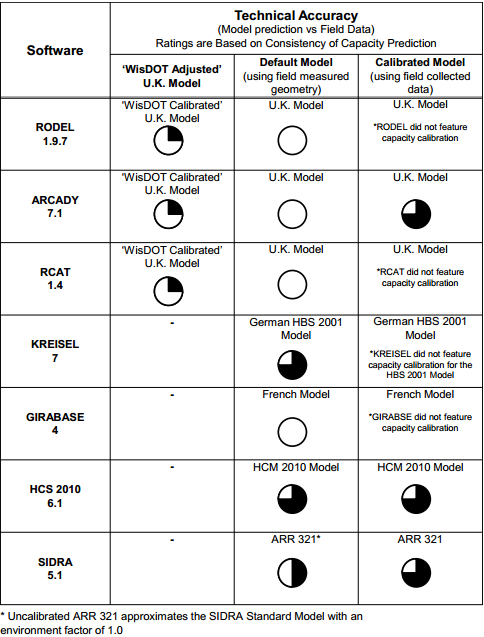
Figure 3. Software and model technical accuracy summary. [ref]
References:
- Zhixia Li, Michael DeAmico, Madhav V. Chitturi, Andrea R. Bill, and David A. Noyce. Calibration of VISSIM Roundabout Model: A Critical Gap and Follow-up Headway Approach. In 2013 TRB Annual Meeting, Jan., 2013. [pdf]
- Michael S. DeAmico. Roundabout Capacity and Comparative Software Analysis (Master’s thesis), 2012 [pdf]
- Dongxi Zheng, Madhav V. Chitturi, Andrea R. Bill, and David A. Noyce. Critical Gaps and Follow-Up Headways at Congested Roundabouts. In 2012 TRB Annual Meeting, Jan., 2012. [pdf]
- Dongxi Zheng, Madhav Chitturi, Andrea Bill, and David A. Noyce. Comprehensive Evaluation of Wisconsin Roundabouts Volume 1: Traffic Operations, 2011.
[pdf]
- Dongxi Zheng, Brian Porter, Madhav V. Chitturi, Andrea R. Bill, and David A. Noyce. The Study of The Operational Characteristics at A Heavily Congested Roundabout. In 2011 TRB Annual Meeting, Jan., 2011. [pdf]
SHRP2 Data Processing
The research team has extensive experience working with SHRP2 NDS data. Drs. Noyce and Chitturi are currently working on an Exploratory Advanced Research Program (EARP) project ”Quantifying Driver Distraction and Engagement using Video Analytics” using SHRP2 NDS video data (link). Dr. Lee, collabrator of TOPS lab, helped to develop data reduction and analysis methods for SHRP2 data (Dozza, et al., 2012 and Boyle, et al., 2012) and is part of the team led by Chalmers University that is studying eye glances and distraction using SHRP2 NDS data (Yekhshatya & Lee, 2013).
SHRP2 Data Processing
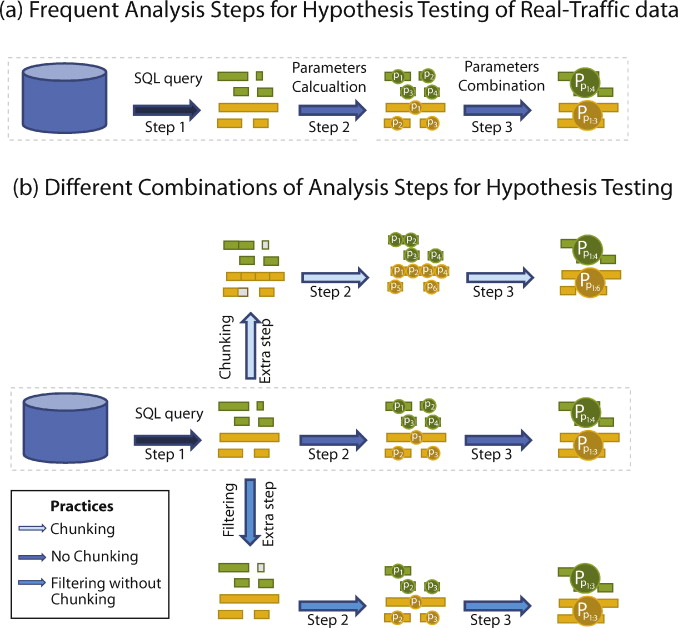
Figure 1. Comparison between conventional data reduction procedure and the proposed chunking procedure. [ref]
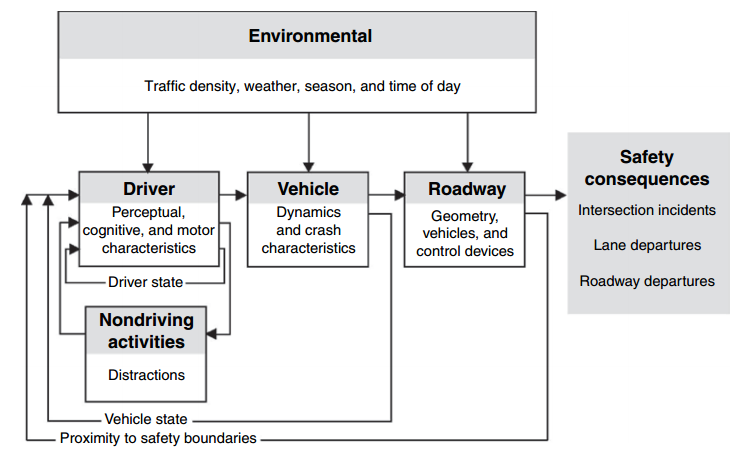
Figure 2. The dynamic relationships between driver, vehicle, roadway, and environment and the resulting safety consequences.[ref]

Figure 3. Data sampling strategies (figure not to scale).[ref]
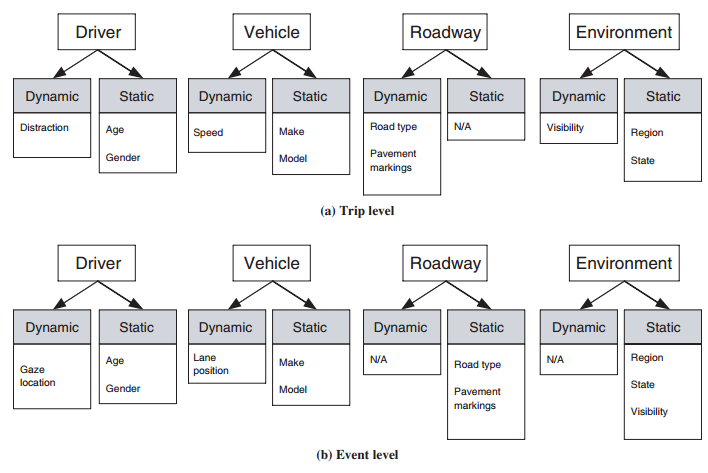
Figure 4. Examples of dynamic and static factors that relate to driver, vehicle, roadway, and environmental variables at the trip level and event level.[ref]
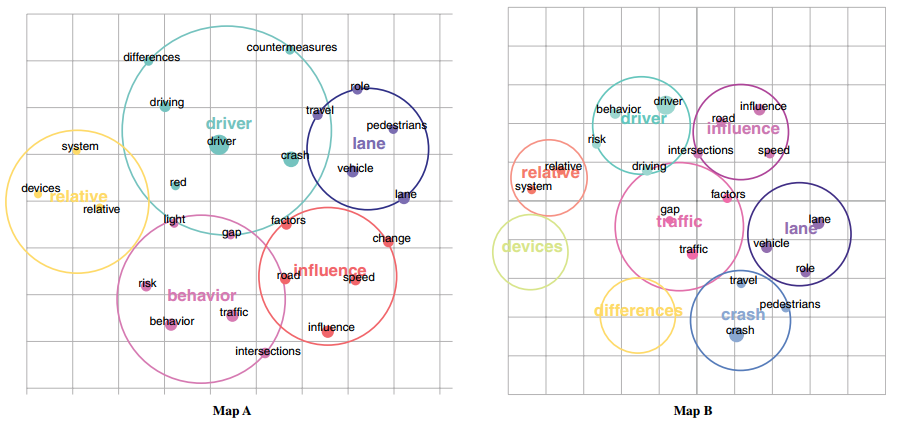
Figure 5. Relationships among S05 contractor questions (five and eight themes).[ref]
References:
- Dozza, M., Bärgman, J., & Lee, J. D. (2012). Chunking: A procedure to improve naturalistic data analysis. Accident Analysis & Prevention. [pdf]
- Boyle, L. N., Hallmark, S., Lee, J. D., McGehee, D. V., Neyens, D. M., & Ward, N. J. (2012). Integration of Analysis Methods and Development of Analysis Plan. SHRP2 (Strategic Highway Research Program). [pdf]
- Yekhshatya, L., & Lee, J. D. (2013). Changes in the correlation between eye and steering movements indicate driver distraction. IEEE Transactions on Intelligent Transportation Systems. [pdf]


